
The economic impacts of the COVID-19 pandemic influenced the integration outcomes of – both and in Canada. In general, these groups are more negatively affected by the COVID-19 crisis than those born in Canada, and these disparities create additional barriers to the integration process. Tracking the impact of the COVID-19 pandemic on immigrants relative to the Canadian-born population with empirical evidence and incorporating this into the CIMII is especially critical. In order to explore this, two analyses have been conducted.
Alberta
Data below is based on the monthly Labour Force Surveys collected from January 2019 to December 2020.
Below you will find 1) CIMII Ranking/ Adjusted Data and 2) Unadjusted Data.
CIMII RANKINGS
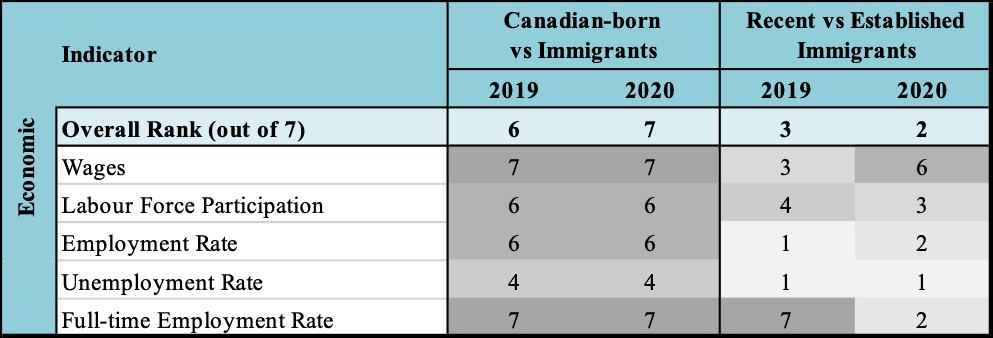
Alberta ranks #6 out of the 7 regions for immigrant economic integration in 2019 and #7 in 2020. It ranks higher when the gap between recent and established immigrants is compared (#3 in 2019 and #2 in 2020).
Alberta performs average on certain economic indicators, including unemployment rate, but performs relatively poorly on other indicators such as wages and full-time employment rate. In 2020, Alberta performed very well in almost all indicators when the gap between recent and established immigrants is analyzed.

UNADJUSTED DATA
See below for the breakdown of immigrants, recent and established, and the Canadian-born population in this region. Any blank in the chart indicates that the data is unavailable/statistically insignificant. Please note that the data below does not control for socio-demographic characteristics, unlike our rankings above.
Median weekly wages (full time)
Median weekly wages (full time) Without accounting for socio-demographic differences, full-time immigrant workers consistently earned less than their Canadian-born counterparts prior to and during the pandemic, with the gap varying from $122 to $280 in most survey months. The only exception was at the onset of the pandemic in April 2020, when established immigrants earned the same as non-immigrants.
Note: All wages seen here are before Consumer Price Index (CPI) adjustment
Median weekly wages (part time)
Without accounting for socio-demographic differences, part-time immigrant workers earned less than the Canadian-born in most survey months leading up to and during the COVID-19 crisis. The gap was varying, but it was less than $80. Recent immigrants were the group that had the lowest wage during these two years, with the exception of the three-month period from August to October 2019.
Note: All wages seen here are before Consumer Price Index (CPI) adjustment
Labour force participation
Without accounting for socio-demographic differences, the gap between immigrants and the Canadian-born population varied before and during the pandemic, although it stayed relatively small (less than 6%). The gap was even smaller between recent and established immigrants (less than 4%). There was a drop in labour force participation in 2020 between February and April for all groups; the smallest decline was for the Canadian-born (6.5%) and the largest for established immigrants (9.4%).
Employment rate
Without accounting for socio-demographic differences, the gap between all groups of immigrants and the Canadian-born population varied; in January 2019, non-immigrants were the least likely to be employed. That changed by June of that year when this group was more likely to be employed. However, after May 2020, the Canadian-born were more likely to be employed than any other group. From February 2020 to April 2020, there was more than an 11% drop for all groups (the largest was for recent immigrants, 15.6%).
Unemployment rate
Without accounting for socio-demographic differences, until June 2020, recent immigrants were consistently more likely to be unemployed than established immigrants over the survey months; after this point, established immigrants were more likely to be unemployed. The unemployment rate varied for all groups, but it went sharply up at the onset of the pandemic in April 2020. The biggest jump in unemployment was for recent immigrants (9.3%) and the smallest for the Canadian-born (8.3%). After April 2020, the unemployment rate went down for all the groups, except for established immigrants. It was not until August 2020 when the unemployment rate started going down for established immigrants.
Full-time employment rate
Without accounting for socio-demographic differences, established immigrants in most survey months prior to and during the pandemic were more likely to work full-time than recent immigrants; the gap varied and was at its largest in July 2019 (9.8%). The gap between immigrants and Canadian-born was smaller across all survey periods (less than 2.6%).